- Submissions

Full Text
Evolutions in Mechanical Engineering
Simulation and Prediction of TDS Concentrations in Observation Wells in a Groundwater System Using FEFLOW
Sindhu G1 and Lekshmi Vijayachandran2*
1 Department of Civil Engineering, College of Engineering Trivandrum, India
2 Department of Civil Engineering, Chengannur, St Thomas College of Engineering and Technology, India
*Corresponding author:Lekshmi Vijayachandran, Department of Civil Engineering, St Thomas College of Engineering and Technology, Chengannur, India
Submission: November 05, 2018;Published: January 22, 2019

ISSN: 2640-9690 Volume2 Issue3
Abstract
Groundwater is a major source for drinking and domestic purposes. Nowadays, extensive pumping has become a major issue of concern since pumping has led to rapid decline in the groundwater table, thus imposing landward gradient, leading to saline water intrusion especially in coastal areas. Groundwater pumping has seen its utmost effect on coastal aquifer systems, where the sea- ward gradient gets disturbed due to anthropogenic influences. Hence, a groundwater contaminant transport modelling of an aquifer system is essential for understanding the various hydro- geologic conditions, which can be used to study the responses of the aquifer system with regard to various pumping and recharge scenarios. Besides, a model helps to predict the water levels for the future period with respect to changing environment. In this study, a finite element groundwater contaminant transport model of a coastal aquifer system at Aakulam, Trivandrum district is developed, calibrated simulated and predicted using the software Finite Element subsurface Flow system (FEFLOW 6.2).
Keywords:Contaminant-transport modelling; Finite element model FEFLOW; TDS
Introduction
Water is one of the most important natural resources to a lifesupport system. The hydrosphere on the surface and near surface of the earth is the basis for all living species on the planet. Nowadays, the wetlands are transformed into settlement areas, leading to large-scale withdrawal of groundwater resources. This in turn pose an enormous threat to our future well-being causing adverse effects on the ecological and environmental balance of our nature. The saline water intrusion has become a major problem now-adays, especially in coastal areas, as the population in these coastal regions is increasing at a faster rate and is in greater need of fresh water resources. Besides, the sea water intrusion is causing adverse effects on the ecological and environmental balance of our nature, thus causing an enormous threat to our future well-being. The limited potable drinking water supply has become one of the major threatening consequences imposed by the sea water intrusion. Also, salinity in the irrigation water has brought detrimental effects on the agriculture, thus considerably reducing the crop yield and killing crops which are having low tolerances to salt [1].
Overview of the Study
Groundwater modelling has become a major part of many projects dealing with groundwater exploitation, protection and remediation. Numerical models describe the entire flow field of interest at the same time, providing solutions for as many data points as specified by the user. Models have been applied to investigate a wide variety of hydro- geologic conditions. Nowadays, groundwater models are applied to predict the groundwater level and transport of contaminants for risk evaluation. Based on various methods of approximating differential flow equations, the numerical methods can be divided into Finite Element method (FEM) and Finite Difference method (FDM).The main objective of the study is to develop a two dimensional finite element contaminant transport model using Finite Element subsurface Flow system (FEFLOW) for the pre and post monsoon seasons and to study the effect of pumping and recharge on contaminant transport in the observation wells through scenario analysis. The model is then used to predict the contaminant transport for a future 5-year period during the pre-monsoon and post monsoon season.
The study area (4.6kmx3.5km) is located at Aakulam, a tourist village, which is nearly 10km from the Trivandrum city center as shown in Figure 1. It is well known for the picnic and backwater destination Aakulam Lake, an extension of Veli Lake and lies within the watersheds of Parvathy Puthanar. The general climate of the area is mainly a tropical climate and is influenced to a large extent by the conditions in the Arabian Sea. The community set up of this area is typically of mixed type, wherein both rural and urban communities’ live side by side.
Figure 1:Study area with well locations.
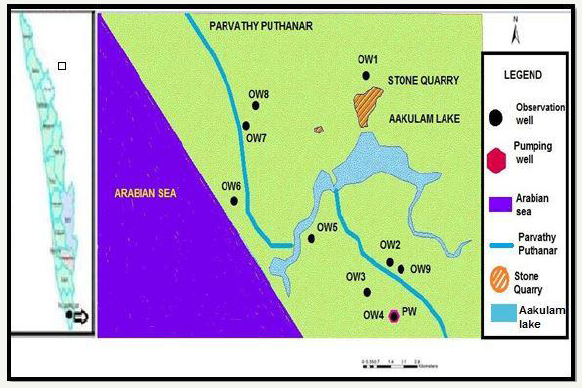
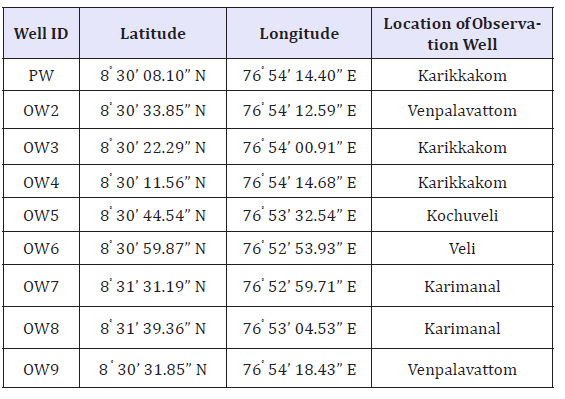
Data Used The drinking water requirement of this area is mainly met from groundwater sources. A pumping well is located at a distance of 1.05km from the seashore. The location of the pumping well and pumping rate during the pre-monsoon and postmonsoon periods were obtained from the Kerala Water Authority as given in Table 1. The fluctuations of water table in the nearby wells mainly depend on the pumping from the pumping well. In order to study the effect of pumping, nine observation wells were selected, and their locations were identified using a handheld GPS as given in Table 2.
Table 1:Pumping rate of pumping well.

Table 2:Locations of pumping well and observation wells.
Methodology
Figure 2:Finite element mesh showing active-inactive elements.
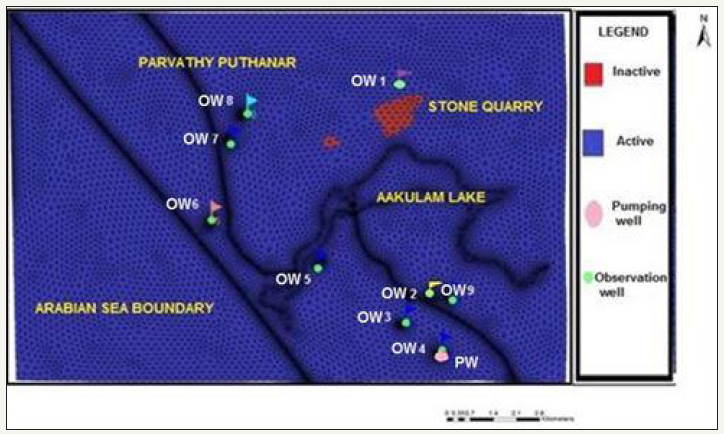
The governing partial differential equation for contaminant transport is given in equation 1∂C/∂t =∇. (D.∇ .C)- ∇.(v C)-(qs Cs)+ΣRk----1 where D is the hydrodynamic dispersion coefficient, qs is the volumetric flow rate representing sources and sinks, v is the fluid velocity, Cs is the solute concentration of water entering from sources or sinks and Rk (k=1,---N) is the rate of solute production or decay in reaction k of N different reactions. Discretization of Study Area The aquifer domain of the study area was discretized into triangular units with 19,163 elements and 10,419 nodes using Triangular algorithm as shown in Figure 2. A stone quarry located near Alathara region was assigned in the model domain as inactive, where no simulation would be carried out. The finite elements generated at the Arabian Sea boundary, Parvathy Puthanar, Aakulam lake and the wells are denser and finer since the areas of interest lie around these node points.
Boundary Conditions and Material Properties
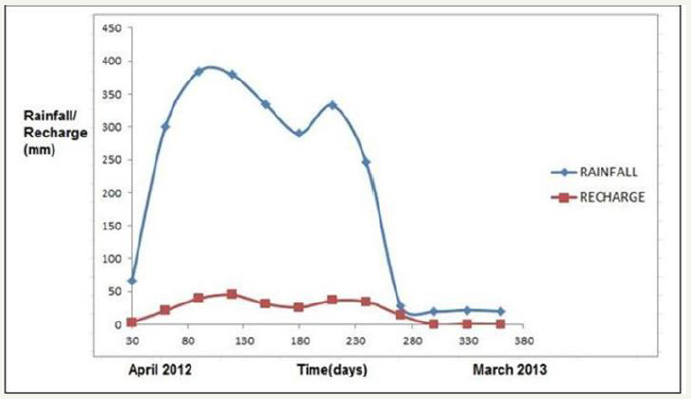
For this model, solute transport concentration is expressed in terms of Total Dissolved Solids (TDS) since TDS is the main contaminant in the study area. A concentration of 35,000mg/l (seawater TDS) is used along the coastal zone where the simulated inflow from ocean occurs (mass boundary of first kind). The concentration at the model flow boundaries is set as 0mg/l. The mass concentration boundary condition is assigned with a minimum mass flow constraint of 0g/d. Density ratio value of 0.025 was input into the model as a flow parameter. A special boundary condition called saltwater head is used to calculate the equivalent head automatically. The saltwater head is assigned as 0m to the sea side region. The groundwater recharge is applied as 2nd kind Neumann boundary condition to the study area. The default parameters are used for the mass transport properties for the model. The TDS values of Parvathy Puthannar are assigned as 672mg/l and 666mg/l during the two seasons under mass transfer boundary condition. The material properties for the contaminant transport model have been assigned to the study area as given in Table 3. The recharge pattern for the period 2012-2013 is shown in Figure 3. Table 4 gives the distance of observation wells with respect to the seashore and Parvathy Puthanar [2].
Table 3:Material properties of contaminant transport model.
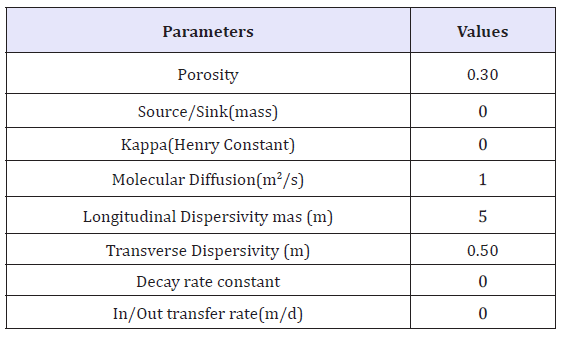
Table 4:Distance of observation wells with respect to the seashore and parvathy puthanar.
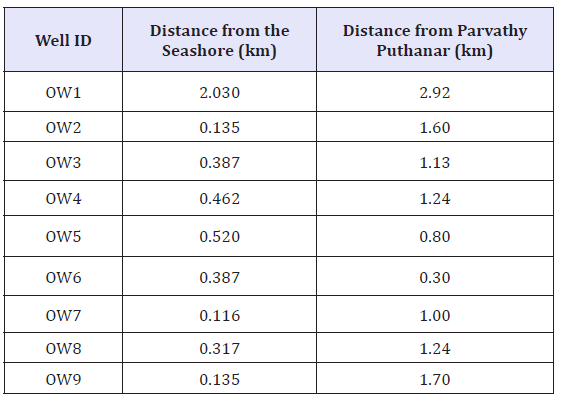
Figure 3:Rainfall-recharge pattern for the period (2012-2013).
Model Calibration
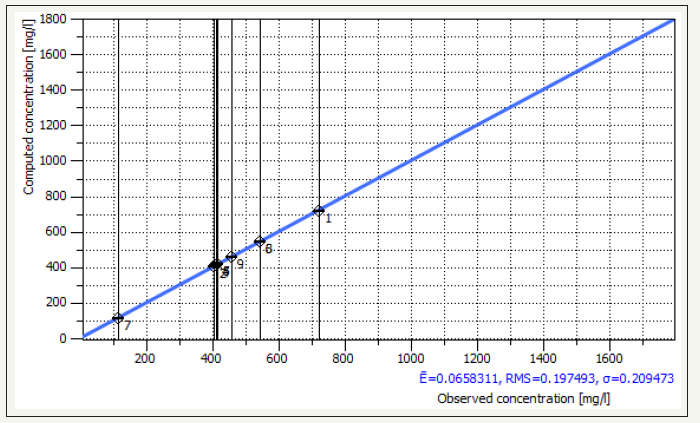
Calibration is the process of refining the model representation of the hydraulic properties to achieve a desired degree of correspondence between the model simulations and observations of the solute concentrations. In this study, calibration of contaminant transport model is achieved by adjusting the dispersivity values until the observed solute concentration matches with the calculated solute concentration. The TDS concentrations in each observation well are measured for the pre and post monsoon seasons. The calibration is stopped when a reasonable match between the observed and calculated concentration is achieved. After the calibration of contaminant transport model, root mean square error of 0.0908285 with a standard deviation of 0.289015 are obtained for the pre-monsoon season as shown in Figure 4, whereas in the post monsoon season, root mean square error of 0.0658311 with a standard deviation of 0.209473 are obtained as shown in Figure 5. Longitudinal and transverse dispersivity values were modified by trial and error in order to match the observed and simulated values. Calibration shows that mass transport model is sensitive to dispersivity values. Table 5 gives the calibrated parameters of the contaminant transport model.
Table 5:Calibrated parameters of contaminant transport model.

Figure 4:Calibration chart for contaminant transport model for pre-monsoon season.
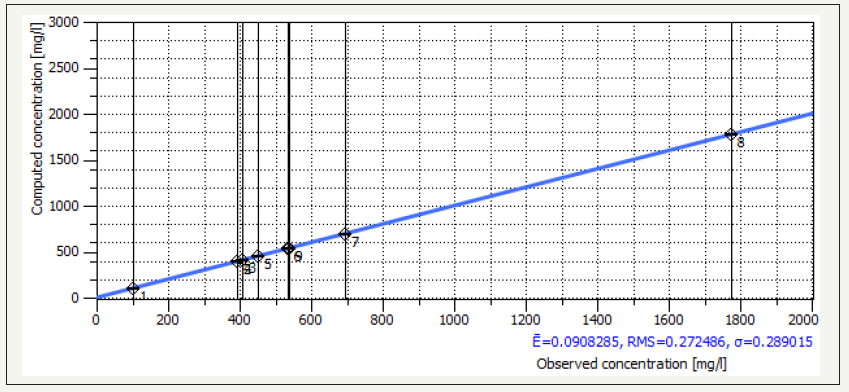
Figure 5:Calibration chart for contaminant transport model for post monsoon season.
Model Simulation The simulation period for the contaminant transport model extends from April 2012 to September 2012 for the pre-monsoon season and October 2012 to March 2013 for the post monsoon season. The calibrated model is run during the simulation period to obtain the TDS concentrations for each season. The transient simulation of the calibrated contaminant transport model is carried out using the Automatic predictor-corrector scheme with a time step length of 1day and final time as 180 days (premonsoon) and the remaining 180 days (post monsoon) to reach steady state conditions. The simulated TDS concentrations for pre and post monsoon seasons are shown in Figure 6 & 7 respectively. In Figure 6, the TDS concentration in observation well OW9 is found maximum, while it is found minimum in observation well OW1. The TDS concentration is found to be 1800ppm in observation well OW9 during pre- monsoon season due to the contamination from Parvathy Puthanar. The observation well OW9 lies very close to the downstream side of Parvathy Puthanar which is the major source of contamination [3]. Moreover, the area is highly populated and hence the dumping of waste materials in the water bodies has become a practice. Besides, a highly contaminated tributary of Aakulam lake (Amayizhchan Thodu) flows along the eastern part of the observation well OW9 which has adversely affected its water quality.
Figure 6:Simulated TDS concentrations in observation wells during pre-monsoon.
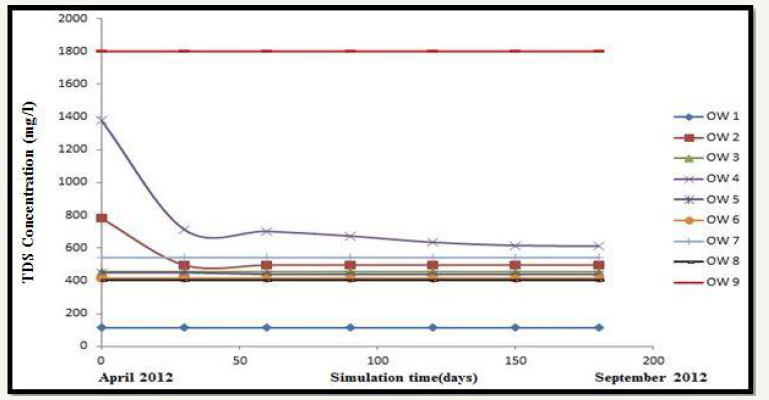
Figure 7:Simulated TDS concentrations in observation wells during post-monsoon.
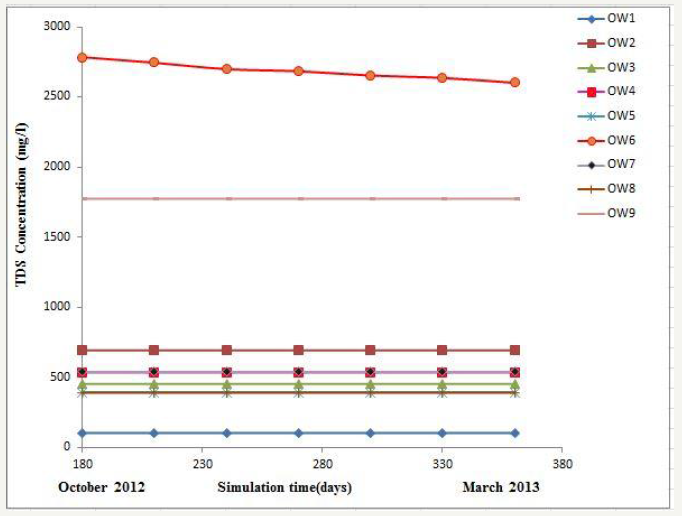
In Figure 7, the TDS concentration in observation well OW6 is found maximum which is about 2700ppm due to the contamination from Parvathy Puthanar as well as due to its lowest elevation. But in observation well OW1, the TDS concentration is found minimum due to its location characteristics. The observation well OW6 lies in the Veli region nearly 200m away from the Arabian sea and 100m away from the Parvathy Puthanar river. This is a coastal zone where many of the wells have been abandoned and the residents are mainly dependent on other alternative water resources. The water sample collected from OW6 shows high TDS concentration which indicates that Veli and its surrounding areas are subjected to saltwater intrusion. The TDS concentration in observation well OW9 is found to be 1774mg/l and remains constant throughout the season The TDS concentrations in all the observation wells, except OW2, OW6 and OW9, are found within the permissible limit. Hence during both seasons, the water bodies like Parvathy Puthanar and Aakulam lake are found to be the major sources of contamination.
Model Prediction
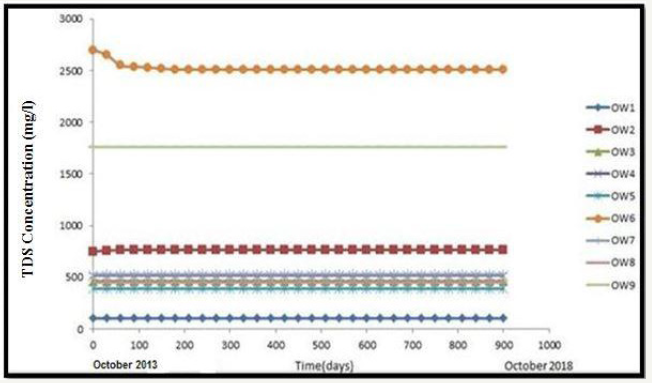
The simulated contaminant transport model is used for predicting the TDS concentrations for future five-year period (2013-2018) during the pre-monsoon and post monsoon seasons. The predicted TDS concentration in each observation well during pre-monsoon and post monsoon seasons is shown in Figure 8 & 9 respectively. In Figure 8, the TDS concentration is found maximum in observation well OW9 and minimum in OW1 during pre-monsoon season. The TDS concentrations in observation wells OW2 and OW4 decrease initially and then maintain equilibrium, while the TDS concentrations in other observation wells maintain a constant trend throughout the pre-monsoon season. In Figure 9, the TDS concentration is found maximum in observation well OW6 and minimum inOW1 and maintain a constant trend in all other observation wells during post monsoon season [1-4].
Figure 8:Predicted TDS concentration in observation wells during pre-monsoon season.
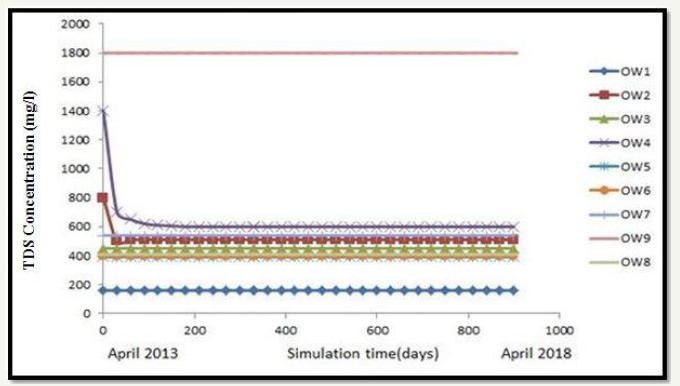
Figure 9:Predicted TDS concentration in observation wells during post monsoon season.
Conclusion
Coastal tracts of Trivandrum city are nowadays facing the problem of groundwater pollution due to increased urbanization and population explosion. The surface water bodies and other ground water resources are getting degraded day by day due to the excessive groundwater withdrawal, dumping of sewage and sullage waste, slum dwellings and other anthropogenic influences. Hence it becomes truly essential to develop a contaminant transport model in order to understand the behavior and responses of the groundwater aquifer system with respect to changing scenarios. The performance of different scenarios was compared and analyzed. Based on the performance criteria, a solution can be derived to protect and manage the groundwater aquifer system. In this study, a finite element groundwater flow and contaminant transport model of Aakulam, Trivandrum district is developed using FEFLOW 6.2 and following are the crucial conclusions drawn from the study. A two-dimensional contaminant transport model was developed, calibrated , simulated and predicted. The temporal variation of mass concentration in different observation wells was simulated. The study reveals that the influence of the recharge boundary (Parvathy Puthanar), is so considerable that renovation of this water body can be the ultimate solution for solving the quality issues of groundwater in the observation wells in the study area. Hence, a new lease of life for Parvathy Puthanar is truly essential for the present and future times.
References
- Rastogi AK (2007) Numerical groundwater hydrology (1st edn), India.
- Sindhu G, Ashitha M, Jairaj PG, Raghunath R (2012) Modelling of coastal aquifers of trivandrum. Procedia Engineering 38: 3434-3448.
- Sindhu G, Tony C (2013) Numerical modelling of coastal groundwater system-A case study. Trivandrum, India.
- Sindhu G, Vijayachandran L (2018) Effect of pumping on groundwater levels-A case study. Journal of The Institution of Engineers (India): Series A 99(2): 369-377.
© 2019 Lekshmi Vijayachandran. This is an open access article distributed under the terms of the Creative Commons Attribution License , which permits unrestricted use, distribution, and build upon your work non-commercially.
 a Creative Commons Attribution 4.0 International License. Based on a work at www.crimsonpublishers.com.
Best viewed in


.jpg)


 Editorial Board Registrations
 Submit your Article
 Refer a Friend
 Advertise With Us
.jpg)


.jpg)


.bmp)
.jpg)
.png)
.jpg)


.jpg)


.png)

.png)


.png)


