- Submissions

Full Text
Open Access Biostatistics & Bioinformatics
Fractal Applications in Bio-Nanosystems
MS Swapna1 and S Sankararaman2*
1Department of Optoelectronics, India
2Department of Nanoscience and Nanotechnology, India
*Corresponding author:S Sankararaman, Department of Nanoscience and Nanotechnology, India
Submission: August 23, 2018Published: March 13, 2019

ISSN: 2578-0247 Volume2 Issue4
Abstract
We live in a world of high complexity in all means. The present article is an attempt to elucidate the potential of fractal analysis in understanding and quantifying the complexity. Of several methods of fractal analysis, we have used only the box counting and power spectral methods for explaining the potential of the technique. The application of fractal analysis in bio-nanosystems, thin films, are forensic science are exemplified though our own work.
Introduction
Fractal geometry is a revolutionary field introduced by the polymath Benoit Mandelbrot that finds wide range of applications in all fields of science, technology, medicine and arts [1- 3]. Fractal objects possess scale invariant self-similarity that are analyzed in non-Euclidean geometry [4]. The word fractal is derived from the Latin word ‘fractus’ which means broken or uneven. According to Webster’s dictionary fractals means any irregular lines, curves or shapes that repeat at any scale based on our examination. Mandelbrot is considered as the father of fractal approach to natural phenomena who went deeper into the fields and problems where other scientists and mathematicians feared to face with [2,3]. The misconception about the Cantor set, the Sierpinski triangle, and the Koch curve as mathematical pathological shapes was solved by Mandelbrot, which lead to the development in the field of fractals [5]. He could observe fractals everywhere in nature such as in ferns, coastlines, clouds, trees etc. These natural objects have a distribution of elements that is similar under magnification over a limited range of scales. They are said to be statistically self-similar natural fractals. The complex geometry of these objects made them highly complex and rich in geometric properties [2,3,6]. Irrespective of the complexity fractals posses self-similarity [6,7]. This nature of fractals is greatly exploited in the nano to the macro world [8,9].
The statistical complexity of a fractal image is expressed in terms of fractal dimension (FD) which is a non integral numerical value. A measure of how much space occupancy by the object between Euclidean and topological dimensions is expressed as Hausdorff-Besicovitch (HB) dimension (D) [2,3]. The important process by which fractals are generated and analyzed is based on the mathematical operation iteration, which simply means to repeat a process again and again. Iteration can be done based on a mathematical rule or any simple construction and thus we get mathematical fractals. The basic unit from which the iteration begins can be termed as a ‘seed’ [6,10]. Even after performing different operations and iterations on a fractal, finally it results in the replica of the initial seed. Depending on the scaling factor, there are different types of FDs [7,11]. Even though in some cases, all these FD coincide to give a single value, basically they are different. The commonly used dimension is the box counting FD which is based on a power-law relation. The information dimension deals with the variation of average information required to identify the filled boxes with respect to the size of the boxes whereas the correlation dimension depends on the number of points considered for the construction of a fractal. If the scaling dimension is different in different regions of the object, it is called as multifractal dimension. Hausdorff dimension takes into account the distance between two points and give an idea about the local size of the space [3]. Thus, various methods have been developed for calculating the various FDs. Some of the methods are the walking-divider, the box counting, the spectral, the successive squares method, the variogram method etc. [2,3,7,11]. The divider method is used to find out the length of cartographic lines. In this method, the number of chord length needed to cover a fractal curve is measured. The slope of the log-log plot between the ruler size and chord length gives the FD. The dependence of FD on the initial point of counting, the selection of ruler sizes, etc. is the drawbacks of this method. FD of self-affine curves can be easily obtained by spectral methods. Power spectrum is the most popularly used method to evaluate the surface topography of a fractal object [12,13]. But the instability of the least square derived values in the bilogarithmic plot and the complexity in computations are the main problem faced while using this method. The variogram method is also suitable for finding the FD of surfaces with identical topologies. The best method that can be adopted to obtain the FD of natural objects such as lakes, islands, etc. is based on the areaperimeter and Korcak’s empirical relations which comes under the area-based methods [11]. The method that is equally applicable to self-similar and self-affine curves is the line-scaling method. Among all these methods, the evaluation of dimension in the real world application is most favored by the box-counting or reticular cell-counting method. Since, it can be applied for point sets, linear and nonlinear features, two-dimensional and three dimensional features (area and volume), the box-counting method finds wide range of applications [2,3,11].
The availability of different methods suitable for any kind of systems has made the fractal analysis a useful analytical technique in all branches of science and technology. The potential of fractals in the study of morphology of highly complex and irregular objects enables its application in the nano-world also. Literature reports [12-17] the use of fractal geometry in the morphological, optical, thermoelectric characterization of nanostructured materials where size and morphology play an important role.
Box-Counting and Power Spectral Method
In the box-counting method, the image is divided into boxes of different size (r). The number (N(r)) of boxes containing the regions of the image is proportional to r-D, where D denotes FD. From the logarithmic relation we get, [2,3,15,17]
lnN(r)=Dln(1/r)+constant (1)
From the slope of ln(1/r) vs. lnf()〖N(r)〗 plot, FD (D) can be calculated.
In the power spectrum method, the Fast Fourier Transform (FFT) of the intensity distribution in the image is calculated using the Origin Pro 8 software. The Power ‘S(f)’, which is the square of the magnitude of the FFT signal is proportional to f-β, where f is the frequency. Taking logarithm of the relation we get
log〖S(f)= -〗 β log〖f+C〗 (2)
From the slope (β) of the plot of Eq. (2), we can calculate the FD (D). [12,14]
D=((5-β))/2 (3)
Application of Fractals in Bio-Nanosystems
The real world is highly chaotic and non-linear [6,18]. Here lies the significance of the fractal geometry by Mandelbrot. The FD, space filling, self-similarity which are some of the important features of fractals helps in quantifying complex systems. The combination of fractal analysis with the dynamical systems can result in non-linear dynamical systems, which can resolve the problems existing in our current technological era that are still unsolved. The invention of fractal antennas, capacitors, radio, radar concepts are the best and latest examples of application of fractals that are used in the advancement of technology [18]. Recently, scientists realized that many of the natural and biological phenomenon or objects in nature can be explained in the most appropriate way by introducing fractals rather than using the conventional Euclidean representations [19]. In the present article is intended to analyze the significance of fractals in bio-nanosystems which can contribute new information to the scientific community and also opens a new area of possibility in research in the field of fractal applications.
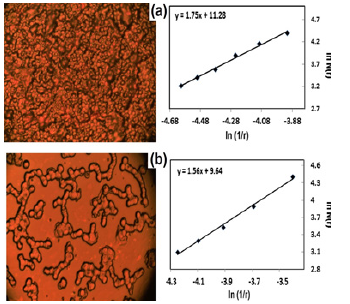
Figure 1:Microscopic image and their lnN(r) Vs ln(1/r) plot of blood samples from (a) normal healthy person (b) dengue infected person.

The relevance of using fractal study for a particular problem depends on the perspective of an objective. It is well known that the complex structure of the bark of a tree can be readily quantified by fractal approach. Similarly we can compare it will the distribution of nerves and veins inside the human body which can also be studied using this method. The double helical DNA strand which stores the biological information has a twisting property which can be explained by fractal concept [20]. The opening and closing of protein ion channels are reported to show fractal properties [21]. Not only in the biological field, but also in the biomedical field this fractal approach facilitates in medical diagnosis of various diseases.
The possibility of fractal analysis in the diagnosis of dengue infected blood samples has also been explored and reported in literature [22]. The microscopic images of blood samples of normal healthy and dengue infected person is recorded and subjected to fractal study. The microscopic image of normal sample and the dengue infected sample with platelet count 4x10⁵/μl and 2x10⁵/μl respectively are shown in Figure 1. The lnN(r) Vs ln(1/r) plot for finding box counting FD is also shown in Figure 1. The FD of infected sample is 1.55 and that of normal sample is 1.75. The increase in FD shows increase in the complexity as evidenced from images in Figure 1. The detailed analysis is given in the literature [22].
The platelet count and FD exhibit high correlation which enables the possibility of predicting the platelet count from the microscopic images of blood samples. Thus the variation in the FD with respect to the platelet count gives information whether the person is dengue infected or not. There are several reports of application of FD in the diagnosis of breast cancer, retinal problems etc. [23,24]. Fractal analysis can also be employed in areas such as law enforcement, financial transactions, access control, and information security [18,25].
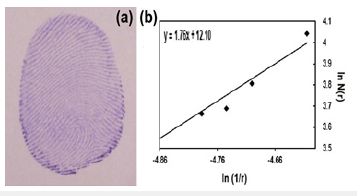
Forensic science is another potential are where FD can be effectively used. As an example, we have carried out a pilot study of application of FD in fingerprint recognition which is the most popular biometric identification method [26,27]. The finger print images are collected and they are divided into boxes of different sizes and FD is calculated using eq. (1). A finger print pattern and its lnN(r) Vs ln(1/r) plot is shown in Figure 2. The FD value is obtained as 1.76. A systematic analysis of finger print patterns and determining the FD by any suitable method can effectively be employed in biometric identification [27].
Figure 2:(a) Finger print pattern (b) lnN(r) Vs ln(1/r) plot of the finger print pattern.

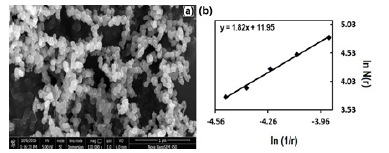
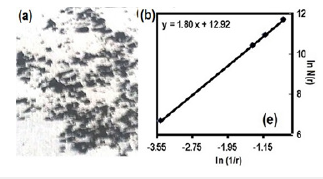
Nanoscience and nanotechnology has now emerged as the technology of the century finding applications in almost all fields of science and technology. How the technique can be extended to the nano world is exemplified through our work on the estimation of carbon nanoparticle size through FD and thereby suggesting the potential of fractal analysis as a surrogate technique for Field emission scanning electron microscopic (FESEM) analysis [15,17]. Carbon nanoparticles (CNPs) play a vital role in the science and technology of twenty first century [28,29]. The introduction of fractal technique is found to be a non-contact and cost-effective method for the size analysis of the soot CNPs by simply taking an ordinary photographs. Here, the FESEM images of CNPs are recorded and its FD is found by the box counting method [15,17]. The FESEM image of camphor soot sample, as an example, and its lnN(r) Vs ln(1/r) plot are shown in Figure 3. The FD is obtained as 1.82. By suitably setting a regression equation connecting the average particle size and FD, we can calculate the particle size by simply recording the photographs of the soot sprinkled over white surface and finding the FD is calculated. An example is shown in Figure 4 and detailed in literature [15]. This method can also give idea about different allotropes of carbon, which are the constituents present in the soot [28-30].
Figure 3:FESEM image (b) lnN(r) Vs ln(1/r) plot of FESEM of camphor soot.

Figure 4:(a) Photographic image of the camphor soot over white paper and (b) its lnN(r) Vs ln(1/r) plot.

Thin films characterization is another field of technology that finds applications in bionanoscience where the method of fractal analysis can be effectively employed. In this article we would like to demonstrate the application of FD to analyze the surface morphology of nanostructured thin films [12,14]. We could see that the box-counting method is better results when compared to power spectral method. We have used the technique to analyze the surface roughness of thin films coated by pulsed laser deposition method and correlated to the roughness values calculated using the atomic force microscopic (AFM) technique. The variations in the films due to annealing or any other parameters will be reflected in the FD values also. The AFM image of the thin films are recorded and subjected to box-counting and power spectral fractal analysis. Figure 5 shows the AFM image, its lnN(ε) Vs ln(1/ε) plot and log s(f) vs. log f of the ZnS thin films coated by the PLD method. The box-counting FD is obtained as 1.98 with high R2 value and that obtained by power spectral method gives a value of 1.68 with low R2 value revealing that box-counting method is the most appropriate method. The surface roughness obtained from the AFM images are correlated with the FD values to set up a regression equation. The reflectivity of a surface is related to surface roughness. Thus, once the surface roughness can be determined through fractal analysis, it can be extended to understand the reflectivity of a surface [31].
Figure 5:(a) AFM image and (b) lnN(r) Vs ln(1/r) plot –box counting method (c) log S(f) vs. log f plot-power spectrum method (thin film at 30 °C).

Conclusion
The potential of fractal analysis is not yet completely utilized. It can be effectively used for variety applications in bionanosystems. What more, it has emerged as a mathematical tool to analyse the microcosm to macrocosm. Though, familiarization of fractals in all branches of science and technology is not possible through a single article, we have made an attempt to draw the attention of readers to the fascinating world of fractals through our work. Thus it can be concluded that the fractal analysis is a potential tool for studying the complex systems by properly selecting a method for finding the FD.
References
- Mandelbrot BB (1983) The fractal geometry of nature. Freeman Alley, New York, USA.
- Kenneth FF (2013) A very short introduction. Oxford University press, United Kingdom.
- Paul S A, Fractals C (1997) An illustrated course. (1st edn), Institute of Physics Publishing, Dirac House, UK.
- Larry SL, Fractals C (1998) Simplified for the life sciences. Oxford University Press, United Kingdom.
- Guoqiang SF (2002) Dimension and fractal growth of urbanized areas. International Journal of Geographical Information science 16(5): 419- 437.
- Nurujjaman M, Ahammad H, Payer A (2017) A review of fractals properties: Mathematical approach. Science Journal of Applied Mathematics and Statistics 5(3): 98-105.
- Annadhason A (2012) Methods of fractal dimension, computation. International Journal of Computer Science and Information Technology & Security (IJCSITS) 2(1): ISSN: 2249-9555.
- Harrar K, Hamami L (2007) The box counting method for evaluate the fractal dimension in radiographic images. 6th WSEAS International Conference on Circuits, Systems, Electronics, Control & Signal Processing, Cairo, Egypt, pp. 385-389.
- Seshadri TR (2005) Fractal analysis of galaxy surveys. Bull Astr Soc India 33: 1-9.
- Peitgen HO, Saupe D (1988) The science of fractal images. Springer- Verlag, Germany.
- Klinkenberg B (1994) A review of methods used to determine the fractal dimension of linear features. Mathematical Geology 26(1): 23-46.
- Soumya S, Swapna M S, Sankararaman S (2017) Nondestructive evaluation of surface roughness of thin films through fractal analysis. International Journal of Nanotechnology and Applications 11(3): 255- 259.
- Markel VA, George TF (2001) Optics of nanostructured materials. John Wiley& sons, USA.
- Soumya S, Swapna MS, Vimal R, Mahadevan PVP, Sankararaman S (2017) Fractal analysis as a potential tool for surface morphology of thin films. The European Physical Journal Plus 132: 551.
- Swapna MS, Sankararaman S (2017) Fractal analysis - A surrogate technique for material characterization. Nanosystems: Physics, Chemistry, Mathematics 8(6): 809-815.
- Tripol’skii AI, Serebrii TG, Lemesh NV, Khavrus’ VA, Ivashchenko TS, et al. (2009) Fractal analysis of carbon nanotube agglomerates obtained by chemical vapor decomposition of Ethylene over nickel nanoparticles. Theoretical and Experimental Chemistry 45(2): 103-107.
- Swapna MS, Saritha DHV, Vimal R, Sankararaman S (2018) Fractal and spectroscopic analysis of soot from internal combustion engines, The European Physical Journal Plus 133: 106.
- Anupam T (2012) Fractal applications in electrical and electronics engineering. International Journal of Engineering Science & Advanced Technology 2(3): 406-411.
- Kenkel NC, Walker DJ (1993) Fractals and ecology. Abstracia Botanica 17: 53-70.
- Xu J, Chao Y, Chen R (1994) Fractal geometry study of DNA binding proteins. Journal of Theoretical Biology 171(3): 239-249.
- Lewis M, Rees DC (1985) Fractal surfaces of proteins. Science 230(4730): 1163-1165.
- Swapna M S, Shinker SS, Suresh S, Sankararaman S (2018) Raman spectroscopic and fractal analysis of blood samples of dengue fever patients. Bio-medical Materials and Engineering 29(6): 787-797.
- Radu D, Loretta I, Stefan M, Dan PB (2014) Malignant breast tumors: Diagnosis using fractal measures. Proceedings of the 18th International Conference on System Theory, Control and Computing (ICSTCC), Sinaia, Romania.
- Esteban FJ, Sepulcre J, de Miras JR, Navas J, de Mendizábal NV, et al. (2009) Fractal dimension analysis of grey matter in multiple sclerosis. Journal of the Neurological Sciences 282(1-2): 67-71.
- Farhan MH, George LE, Hussein AT (2014) Fingerprint identification using fractal geometry. International Journal of Advanced Research in Computer Science and Software Engineering 4(1): 52-61.
- Maltoni D, Maio D, Jain A, Prabhakar S (2005) Handbook of fingerprint recognition. Springer, (2nd edn), New York, USA, 494: 16.
- Swapna MS, Shinker SS, Lekshmi AS, Sankararaman S (2017) Fractal and fingerprint analysis through phase embedded diffraction pattern. International Journal of Engineering Science and Technology (IJEST) 9(8): 816-820.
- Swapna MS, Sankararaman S (2017) Investigation of graphene oxide in diesel soot. Journal of Materials Science & Nanotechnology 5(1): 103.
- Swapna MS, Sankararaman S (2018) From futile to fruitful: Diesel soot as white light emitter. J Fluoresc 28(2): 543-549.
- Swapna MS, Sankararaman S (2017) Carbon nanonecklaces with carbon nanotubes and carbon dots. International Journal of Materials Science 12(4): 541-548.
- Swapna MS, Nampoori VPN, Sankararaman S (2018) Photoacoustics: A nondestructive evaluation technique for thermal and optical characterization of metal mirrors. Journal of Optics 47(3): 405-411.
© 2018 S Sankararaman. This is an open access article distributed under the terms of the Creative Commons Attribution License , which permits unrestricted use, distribution, and build upon your work non-commercially.
 a Creative Commons Attribution 4.0 International License. Based on a work at www.crimsonpublishers.com.
Best viewed in


.jpg)


 Editorial Board Registrations
 Submit your Article
 Refer a Friend
 Advertise With Us
.jpg)


.jpg)


.bmp)
.jpg)
.png)
.jpg)


.png)

.png)


.png)


